Backing up the configuration of an interactive analysis dialog
Article ID: KB0081265
Updated On:
| Products | Versions |
|---|---|
| Spotfire Statistica | 13.3 and above |
Description
This article talks about how to save the input selections by backing up the Enterprise *.ini Files location.
Resolution
Once a quality control chart has been run, input selections used for that chart may be saved into an *.ini file. Then, to run the chart again, just open that *.ini file from the Quality Control Chart input dialog. The the previously saved chart will be display without the need to re-select input options.
For example:
1. Run an XBar & R chart
2. Click on the minimized dialog at the lower left to display the dialog.
3. At the bottom of the “Charts” tab, click the “Save As” button.
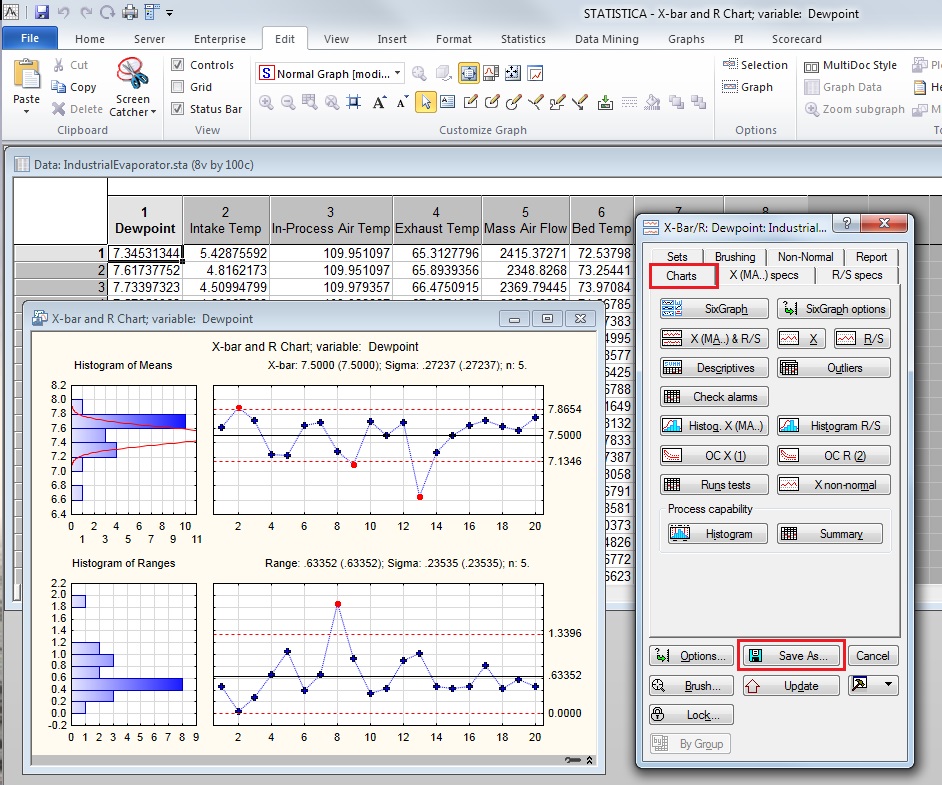
4. Browse to the location where the *.ini file will be saved.
5. Re-create the chart by selecting Statistics—QC Charts—QC Charts to display the Quality Control Charts dialog.
6. At the top of that dialog, click the button to “Open a chart specification file”.
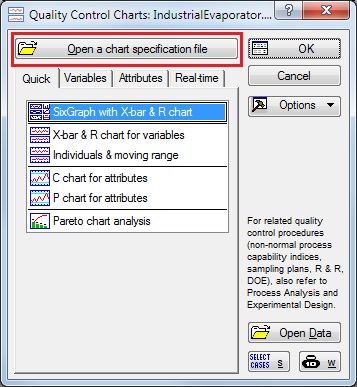
7. Browse to the location where the *.ini file was saved and open it.
That will automatically display the previously generated chart.
Issue/Introduction
Backing up the configuration
Was this article helpful?
Yes
No
Powered by
